
Is your WordPress slow? Then you’re wasting a lot of potential. Not only are your visitors annoyed by the slow loading times, you may also be losing visibility on Google. I’ll show you step by step how you can make WordPress faster.
If you sell something via WordPress, for example with WooCommerce, then there are enough studies that confirm that slow websites make less sales on the bottom line. Mobile users in particular stop loading a page if it takes longer than three seconds. Faster websites are vital for your business.
Measure speed
If you want to make a website faster, you first have to measure how fast/slow it is before optimisation. The pure loading time is important, but not necessarily decisive. Some websites simply have large “assets” (e.g. images and video) that visitors want to see or download. Faster is always better, but it also depends on the visitor’s expectations. For example, apple.com has notoriously poor performance values:

This is not exactly ideal. However, there are good reasons for this. Apple attaches great importance to displaying its own products in the highest possible quality and therefore uses extremely large images without optimising them, as this guide for WordPress shows. Apple visitors accept this and are happy to wait a little longer for the page to load.
Our WordPress speed test
Check your loading time and receive the result by email! Together we’ll find the best solution for you and your company. Or test our WordPress hosting directly for several days free of charge!

Overall, the performance of the Apple pages feels quite fast. In particular, the display of the first elements is usually lightning fast. These are measured under the aspect of “First Contentful Paint” (FCP). The FCP determines the perception of how quickly a page “feels” to load. The FCP therefore plays a particularly important role in optimisation. Values of 2 to 3 seconds should not be exceeded. Less than 2 seconds or faster is better.
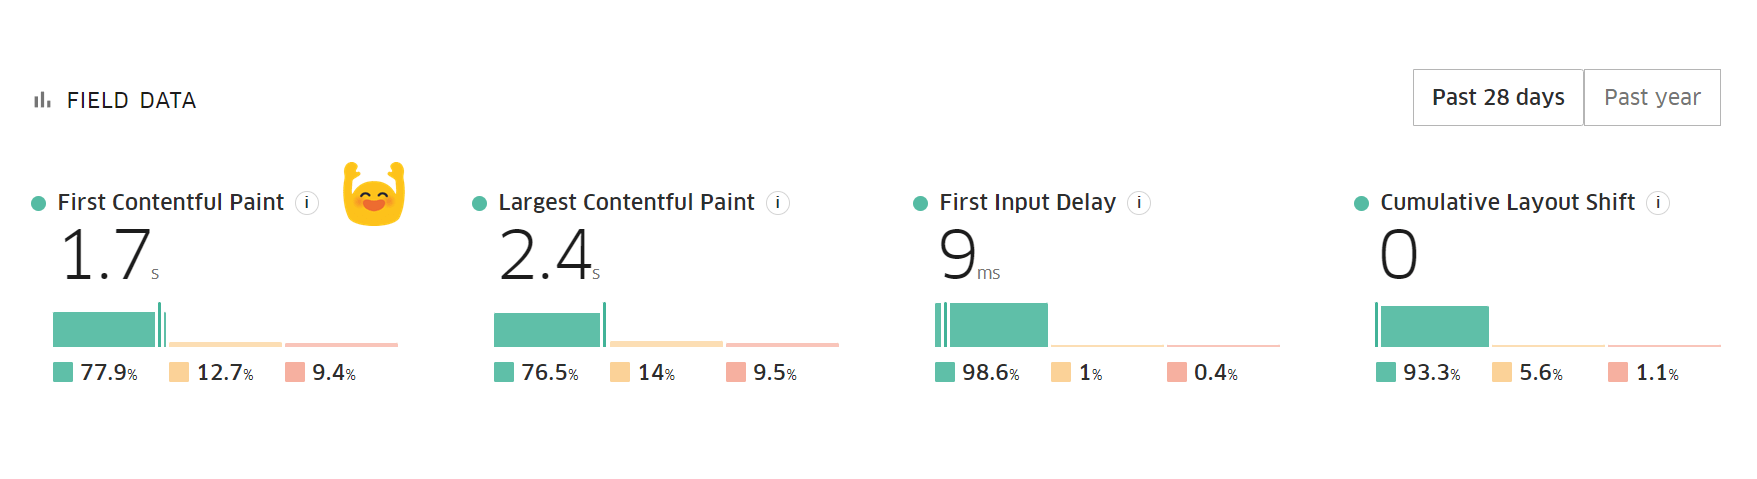
The “Largest Contentful Paint” (LCP) reflects the loading time of the remaining elements from the main content. If you can stay under 3 seconds here, you’re already doing pretty well. However, large product images and similar assets can also push this value up significantly, which is completely okay depending on the purpose.
The “First Input Delay” (FID) measures the time that passes before your visitors can actually interact with the page. For example, highlighting a text passage, clicking a link or button, etc. For example, it could be that a page has a search box. Perhaps this page takes a total of 10 seconds to load completely. How quickly can someone click on the search box and type into the field? Bear in mind that the “user” is not always a human being. It is often bots that interact with pages. For example, the Google bot, which measures the performance of the page and includes these values in the calculation of the rankings.
The “Cumulative Layout Shift” (CLS) should be avoided at all times. If a layout “shifts” during loading, this can be extremely irritating for your visitors. Clicking on the wrong button can be the result. In most cases, such shifts are caused by missing width and length specifications (width/height) for images. The CLS should always be 0.
These four values are therefore crucial when evaluating the speed of a WordPress website. They are user-centred, i.e. not raw performance values such as time to first byte, which plays a major role in the assessment of server performance or the connection to the server. This also means that these values are determined less by caching and selection for WordPress hosting, even if this also plays a major role in WordPress performance. Rather, they are determined by the skilful structure of a page and the correct use of HTML, CSS and JavaScript.
Reduce HTML, CSS and JavaScript
Minifying HTML, CSS, and JavaScript files is one of many small tweaks you can make to optimize the loading speed of your WordPress website. In the article Minify HTML, CSS and JavaScript in WordPress, we explain how you can save loading time by using lean code.
Performance optimisation has become quite complicated in recent years. Especially since Google announced that it would include these user-centred performance criteria in its ranking calculations. The best tools for measuring your WordPress performance:
- PageSpeed Insights from Google
- GTmetrix
- Lighthouse is built directly into the Google Chrome developer tools.
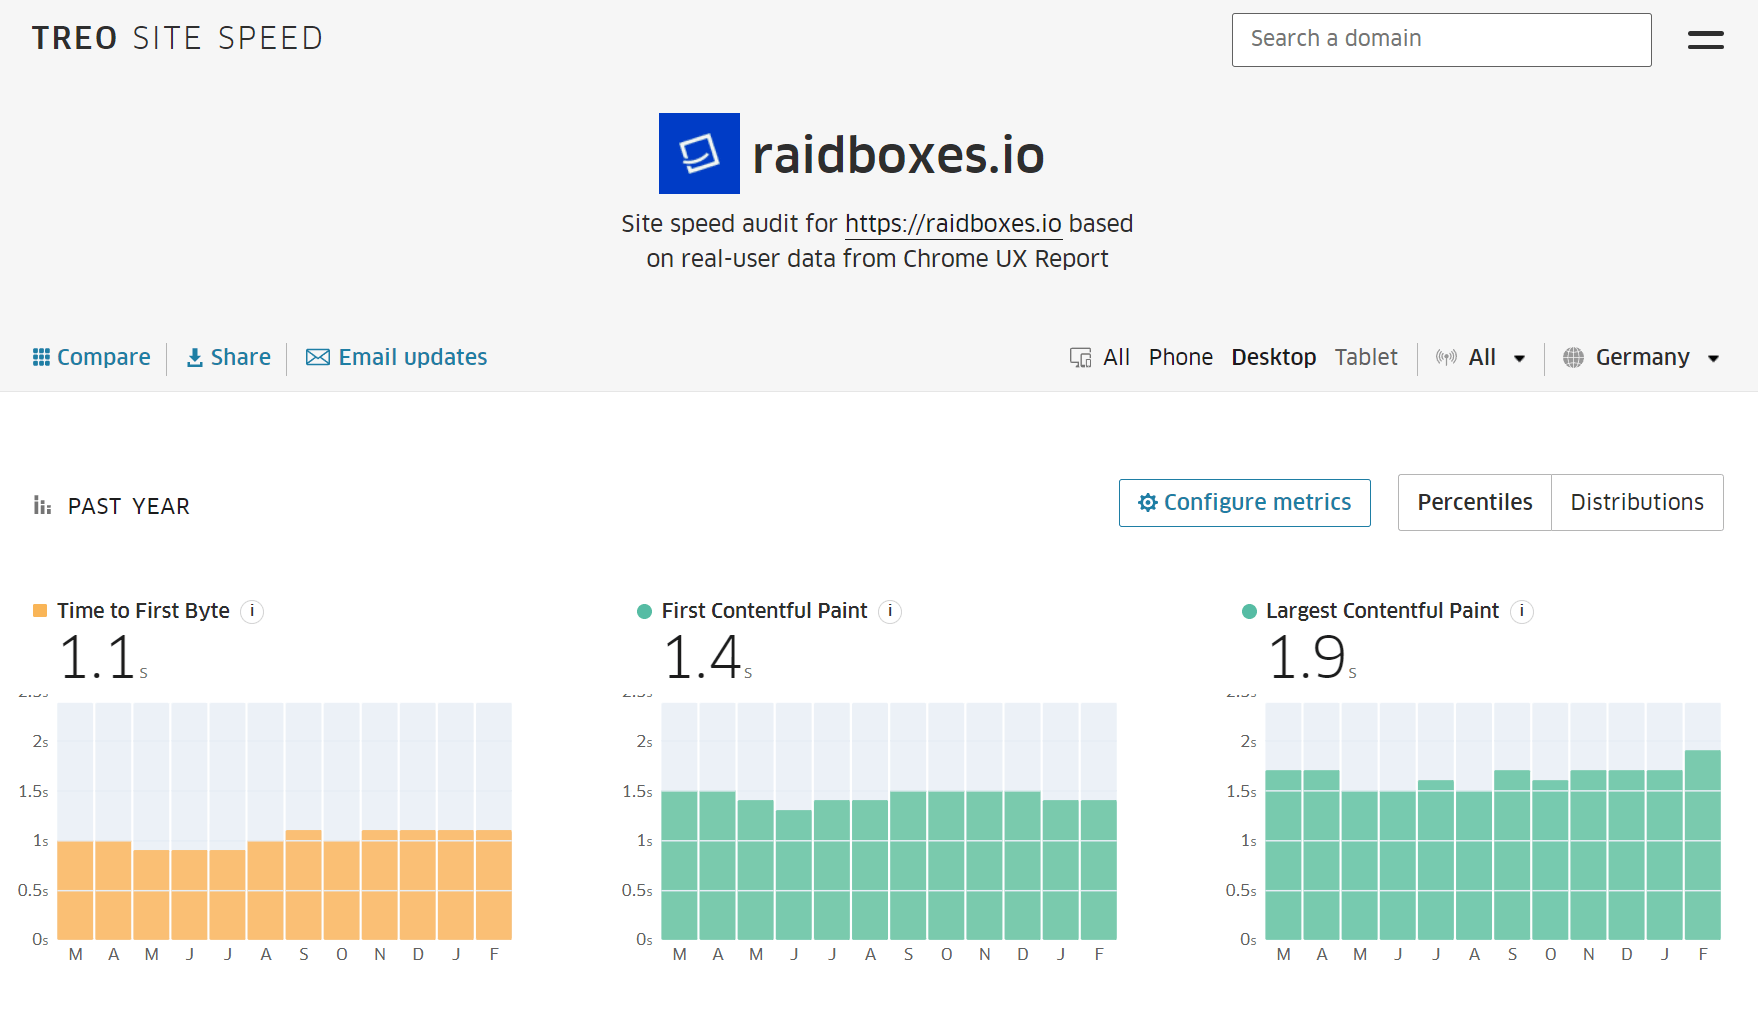
- TREO Site Speed
I personally particularly like TREO because it is fast and clear. PageSpeed Insights and GTmetrix are extremely detailed.
With this prior knowledge and the tools, you are well equipped to measure your own performance. If you are doing this yourself, I suggest the following procedure:
- Firstly, measure the initial state. How fast is your website before optimisation?
- Activate or implement an optimisation.
- You can then measure the performance again. Has it demonstrably made a difference? If not, then remove the optimisation and try something else. If yes, then keep the optimisation. Test whether everything still works as before and add another optimisation.
Many people try to achieve a score of 100 with PageSpeed Insights. There is nothing wrong with this at first, except that it is not necessary to achieve the full score. Other tools measure differently and what is a 100 in PageSpeed Insights may not be as good in GTmetrix. It is also much more important to get from a 30 to a 90 than from a 90 to a 100.
Have you heard of our Performance Add-on yet?
Better performance, faster loading times and improved Core Web Vitals: with the Performance+ add-on from Raidboxes, you can automatically optimise your WordPress website – from caching and image compression to code minification.
Improve WordPress performance
Faster WordPress hosting
There is no such thing as THE fastest hoster in every situation and at all times. There are too many factors that affect the delivery time and processing of requests. The following factors do not exactly make the assessment easy:
- Time of day
- Utilisation of the server
- Geolocation
- The speed of the user’s connection.
Nevertheless, each host offers different packages that can have a significant impact on the performance of a WordPress website. Entry-level packages are usually cheaper and naturally not as fast. Therefore, one of the first sensible optimisations is actually an upgrade of the package.
Raidboxes offers starter packages in Managed WordPress Hosting, for example, which relieve you of administrative work with WordPress and already include optimisations such as server-side caching. But there are also particularly high-performance packages in High Traffic Hosting, for example for projects with very high access numbers. There are also special rates for WooCommerce hosting for your online shop. It goes without saying that the larger packages provide an additional performance boost.
Which WordPress hosting for which project?
Not sure how much performance or which package you need for your website with WordPress or WooCommerce? Or how much the speed of your website can actually increase after the move? Our WordPress experts will be happy to advise you, including on the topic of WordPress performance.
One thing is clear: if you pay more, you usually get more performance. This naturally applies to all hosters. Almost all of the performance tweaks that are applied are increased by tariff upgrades. But what can be gained without directly switching to a higher tariff?
Use WordPress caching
Apart from the simplest blogs, almost every WordPress site uses a variety of other plugins. As a rule, plugins delay the loading time by a fraction of a second each time a page is called up. Especially when the plugin inserts elements into the HTML code that then have to be loaded additionally or perform additional database queries.
What if WordPress only had to perform these additional “tasks” once per page and simply retrieved the result of these “additional” operations from the cache the next time it was called? This would significantly speed up the next loading process, as the server would only have to deliver a finished file. Ideally, no further calculations take place, which drastically shortens the loading time. For example, a page that takes 5 seconds to load uncached can be delivered within milliseconds. Improvements in speed of between 20 and 100 times faster are not unusual when caching is switched on.
WordPress hosting management
With our Raidboxes dashboard, you get a seamless, intuitive interface that makes managing your WordPress sites easier, faster, and more efficient. Check it out!
Caching solutions are essential for speeding up WordPress websites. Ideally via a server-based solution, more on this in a moment. Otherwise, use one of the caching plugins that are very popular in the community:
- WP Fastest Cache (free + chargeable)
- LiteSpeed Cache (free of charge, but only works with the LiteSpeed Web Server)
- WP-Optimize (free + chargeable)
- WP Super Cache (free of charge, from the WordPress manufacturer)
- Hummingbird (free + chargeable)
- WP Rocket (for a fee, here is my tutorial on YouTube)
- Cache Enabler (free of charge)
- Borlabs Cache (fee required)
- Hyper Cache (free of charge)
- Comet Cache (free + chargeable)
Paid plugins usually have more features. However, free plugins help in most cases to squeeze out 90 per cent of all possible time gains.
However, caching plugins are like a bandage. They hide problems that would be better fixed in the first place. They don’t necessarily remove superfluous HTML, they don’t compress oversized image files, they don’t necessarily change the order in which JS and CSS files are integrated, etc. Even cached pages can therefore still be slow.
If you work cleanly from the outset, you “actually” don’t need a caching plugin. At least in theory. Because caching generally reduces the load on the server and is therefore always recommended. I’m more concerned here with the argument in favour of good planning and clean, well-thought-out code.
In addition, Raidboxes relies on particularly high-performance, server-side caching. This means you don’t need an additional plugin or a paid solution.
Flex containers instead of columns and rows in the page builder
Page builders or site builders have become indispensable for many agencies and developers, as they greatly facilitate the design of pages and articles.
Advantages and disadvantages of page builders
Page builders are controversial in the WordPress scene. While some praise their ease of use, others criticize their inefficient source code or bloated websites. See our posts Page Builder: Curse or Blessing and 16 Popular WordPress Page Builders Compared.
For over 10 years, it has been standard procedure in all popular page builders to create the layout with columns and rows. This often leads to a nested DIV salad:

This often happens on every single page, which usually bloats the code unnecessarily and can also have negative effects on the FCP. This can usually be avoided by skilful planning when creating the layout. Site builder manufacturers are now starting to consider the CSS standards Flexbox and Grid for layout creation. This is good news, as it reduces the amount of code.
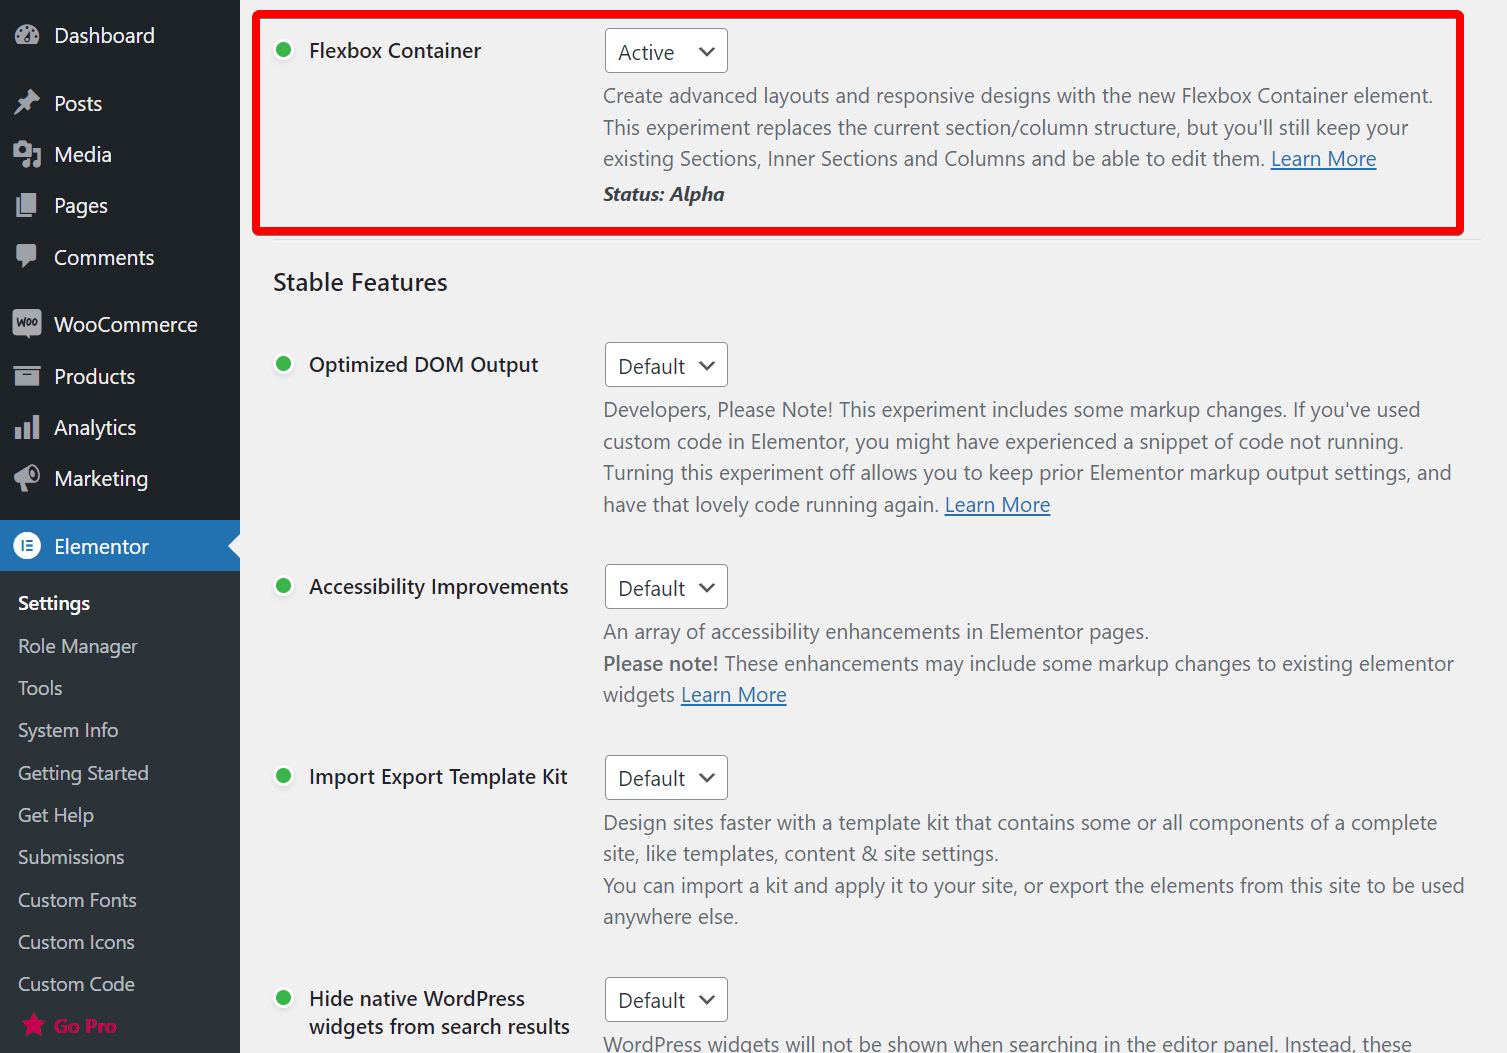
In the current version of the Elementor page builder, for example, the flexbox container can be activated in the settings. This not only gives you more flexibility in the design, it also reduces the HTML code and makes loading times faster.
A click on Direction -> Row aligns the containers in a row. A simple three-container structure will not immediately improve performance dramatically. However, if all sections, rows and columns are implemented with this new technology, the gain can be significant. Especially across many pages and also when optimising FCP and LCP.
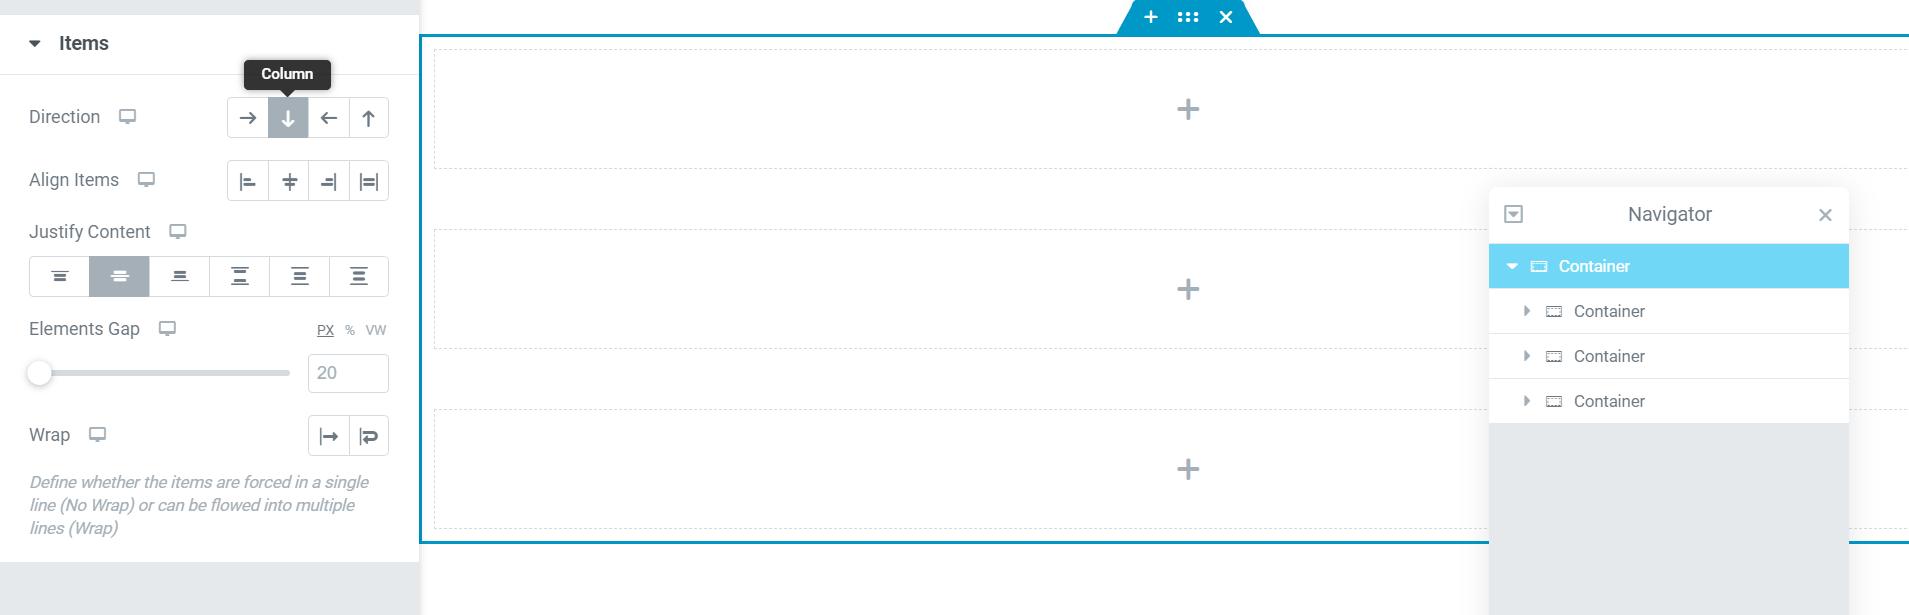
The feature is still in the alpha stage at Elementor. Other builders have been using this new procedure for some time and all builders will offer it in the future. It is therefore worth adopting the new working method into the workflow as quickly as possible.
It is less important to use CSS Flexbox and/or CSS Grid, but rather to avoid nesting. Theoretically, even a table-based layout from the 2000s can be optimised by “de-nesting”.
The right WordPress theme
There are thousands of themes for WordPress. Surely they are all optimised for performance, right? Wrong. Most themes concentrate on looking pretty. That makes sense from a sales perspective. Themes are mainly selected for their attractiveness. Very few WordPress themes really prioritise lean code – or as far as Page Builder is concerned: generating lean code.
In my opinion, these themes and builders are currently recommended:
These are real meta themes, so they allow almost every conceivable layout option, they have an enormous selection of stylish layouts and are optimised for performance from the ground up. Most of these WordPress themes can be combined with other page builders such as Elementor. Some have their own page builder.
Optimise images and other elements
The vast majority of websites use images. Larger images often look better, but also increase loading times. Smaller is better, but regardless, there are a lot of tips to keep in mind:
- Maximum dimensions of less than 2,000 pixels are recommended. Larger images are better opened in a new window.
- The right format is crucial. JPEG for photographic images with many colours and shades, PNGs and GIFs can be significantly smaller for images with fewer colours. It’s best to try it out.
- Vector graphics such as logos and illustrations look great as SVGs, are infinitely scalable and also small. SVGs are also pure text files with instructions from which a graphic is created. As text files, they benefit from GZIP compression, more on this in a moment.
- Google’s WebP format can reduce the size of JPG files by a further 25 to 34 per cent.
- WebP has been around since 2010, but the new AVIF format reduces WebP by a further 30 per cent and often achieves 50 per cent savings compared to JPEG. AVIF does not yet have full support for all browsers, but this is growing from month to month.
There are plugins that convert your images into all formats during upload and then simply integrate the smallest file. Here are the most popular plugins for WordPress:
- Smush
- Optimus
- EWWW Image Optimiser
- ShortPixel Image Optimiser
- TinyPNG
- Imsanity
- Imagify
- reSmush.it
- Kraken.io Image Optimiser
- WP Compress
- Autoptimise
- WP Offload Media
- Optimole
- Hammy
- Robin image optimiser
- WP Compress
- Imsanity
WP Compress has a very clear interface and performs compression tasks in the background. The extension is not exactly cheap, but it is very convenient. If you would prefer to start with a free plugin, you should take a closer look at Imsanity.
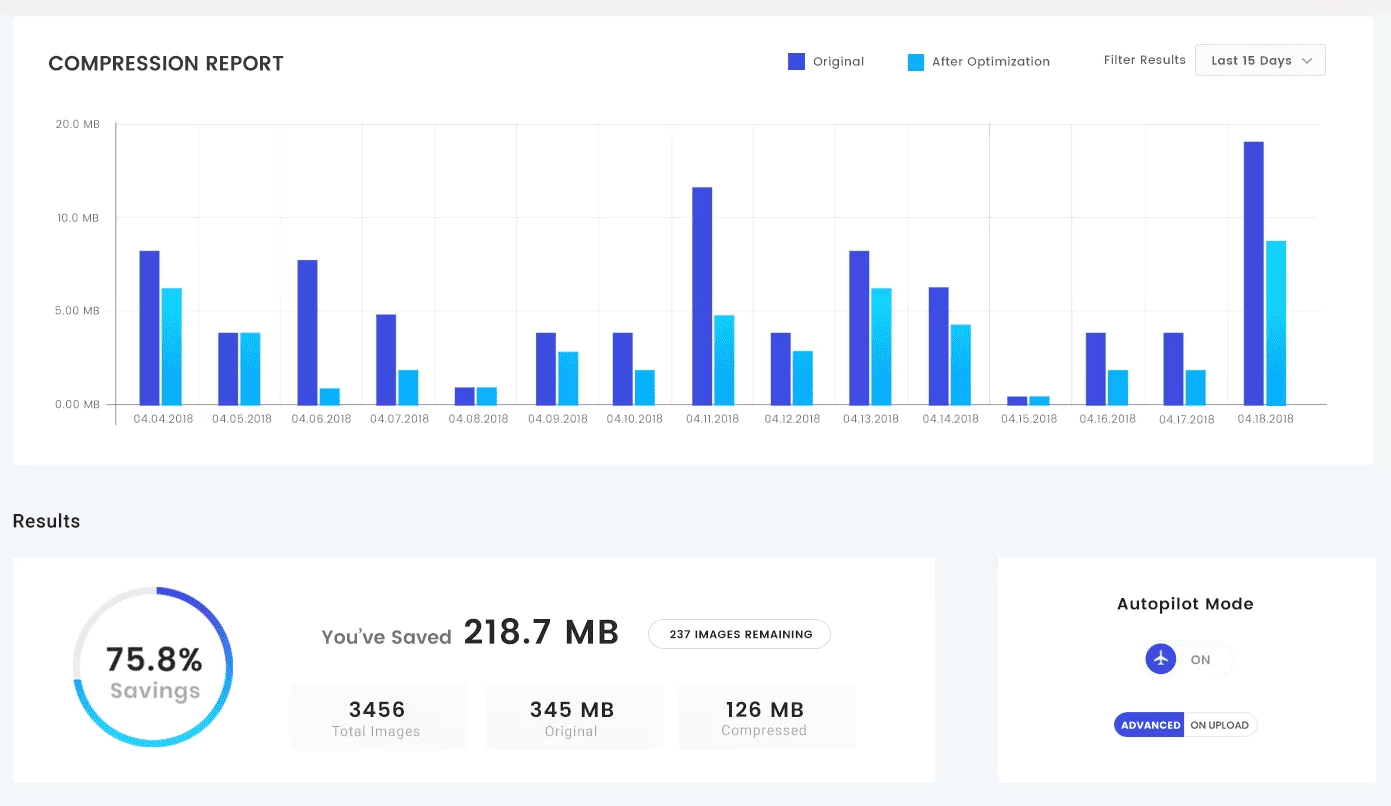
Most optimisers have a premium model that limits either the image size or the number of images. The exception is Robin. Should you even pay for such a plugin? It depends on how much control you need. Alternatively, it is possible to optimise the images yourself with desktop tools, or on the command line(optimizt, compress-images) or online before uploading(TinyPNG, Shortpixel).
Most plugins also create images in different, smaller sizes. Depending on the resolution of the user’s browser, a significantly smaller file is integrated directly, which again leads to significant performance gains.
Lazy loading means that an image is only loaded when your visitors scroll to the point where it appears on the page. Most image optimisers support this. There are also free plugins for this, for example Lazy Load from WP Rocket and Lazy Loader. Videos can or should also only be loaded when “reached”, see Lazy Load for Videos.
Cache fonts
In addition to images, any other assets can be cached locally (on the server). This not only improves compliance with international data protection laws, it also generally improves performance. Especially if the fonts are cached. The browser then downloads them once and displays them directly the next time without having to load them first. This works well with the WordPress plugin OMGF Host Google Fonts Locally, for example.
Selective loading of assets per page
A particularly effective method for increasing speed is to selectively load CSS and JS files depending on the page or post. There are several ways to achieve this.
An example: The WordPress website uses a form manager such as WPForms. This plugin loads its form functions directly on every page. However, this functionality is only required on the contact page. Freesoul Deactivate Plugins is a plugin that supports this:
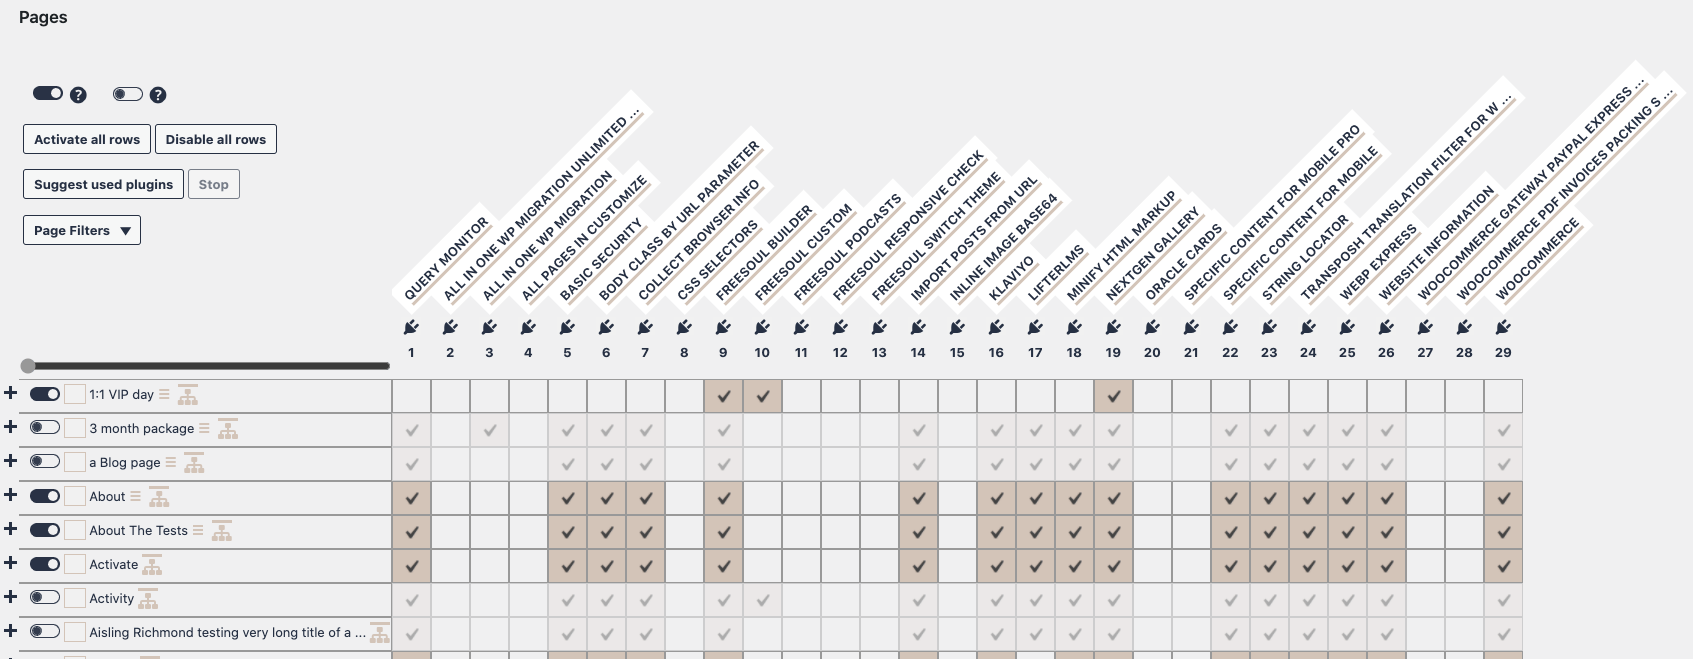
It enables the activation or deactivation of all plugins per page via a matrix. It is also possible to use performance plugins such as perfmatters for this purpose, which also prevents the delivery of CSS and JS files. However, Freesoul suppresses the loading of the entire plugin, which also reduces the work that needs to be done in the background on the server.
Tweaks with perfmatters
Is it worth buying a plugin like perfmatters? Thoeretically, all optimisations can also be carried out manually or with other plugins. However, this would be an insanely large amount of work, especially if it has to be done for several WordPress websites.
A plugin like perfmatters has more than two dozen optimisations in the normal options alone. Are they all useful? That depends on how familiar WordPress users are with the features. For example, the RSS feed can be switched off, which saves a few bytes. However, it also means that visitors to the website can no longer simply subscribe to the posts via RSS feed. So you should think about this carefully.
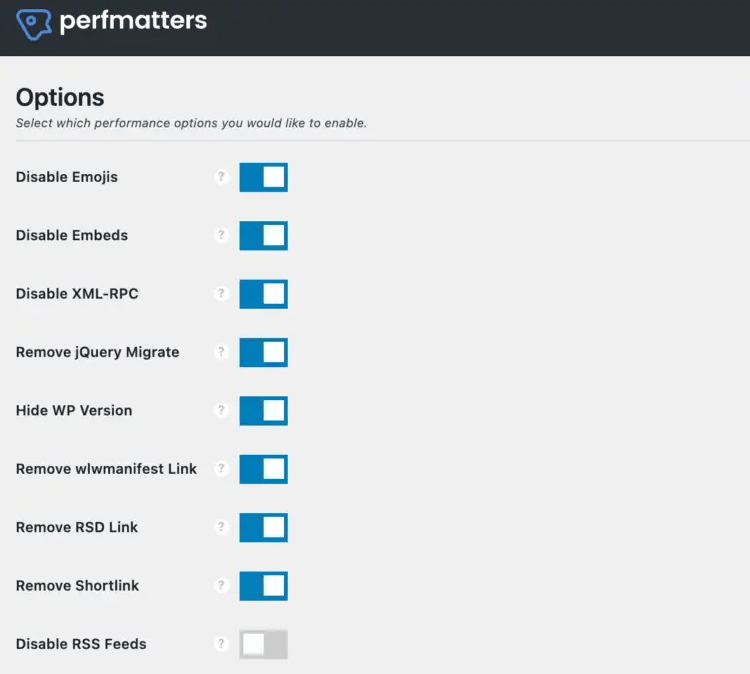
It’s amazing how many gimmicks WordPress has activated by default (emojis, dashicons, etc.), they can be safely deactivated for the time being. You should exercise caution with the settings relating to the database. In theory, deactivating the revisions could waste a lot of working time. If a cache is used anyway, database optimisations are usually not particularly important.
In contrast, the use of Google Maps on a page is usually a disaster for performance. These maps should really only be loaded if absolutely necessary. Many themes include a map on the homepage, for example, but this is not absolutely necessary. In WooCommerce online shops, calling wc-ajax=get_refreshed_fragments can cause severe delays. These can be switched off with “Disable card fragments“.
WooCommerce Hosting
With WooCommerce hosting, you can launch your own online store quickly and securely and manage it professionally – without any technical hurdles. Check our Raidboxes WooCommerce Hosting now.
In any case, it is worth taking a look at the perfmatters and WP Rocket documentation. If you want to dive really deep, you’ll find plenty of starting points there. Of course, you can also simply buy one of these plugins and save yourself a lot of time. However, you will understand less about what happens in the background.
Minification
Minification removes unnecessary characters, especially spaces and tabs, from HTML, CSS and JS files. It is more of a best practice than a real performance boost. Minification can be switched on or off very easily with Autoptimise.
Gzip compression and Brotli
Compared to minification, compression often reduces the file size of text files by more than 50 per cent. It is definitely worth switching this on, for example the Brotli compression algorithm. Such compression is usually already switched on by the web host. If not, there are additional tools that store the files compressed in the file system. This is mainly because the compression of text files is generally much more effective.
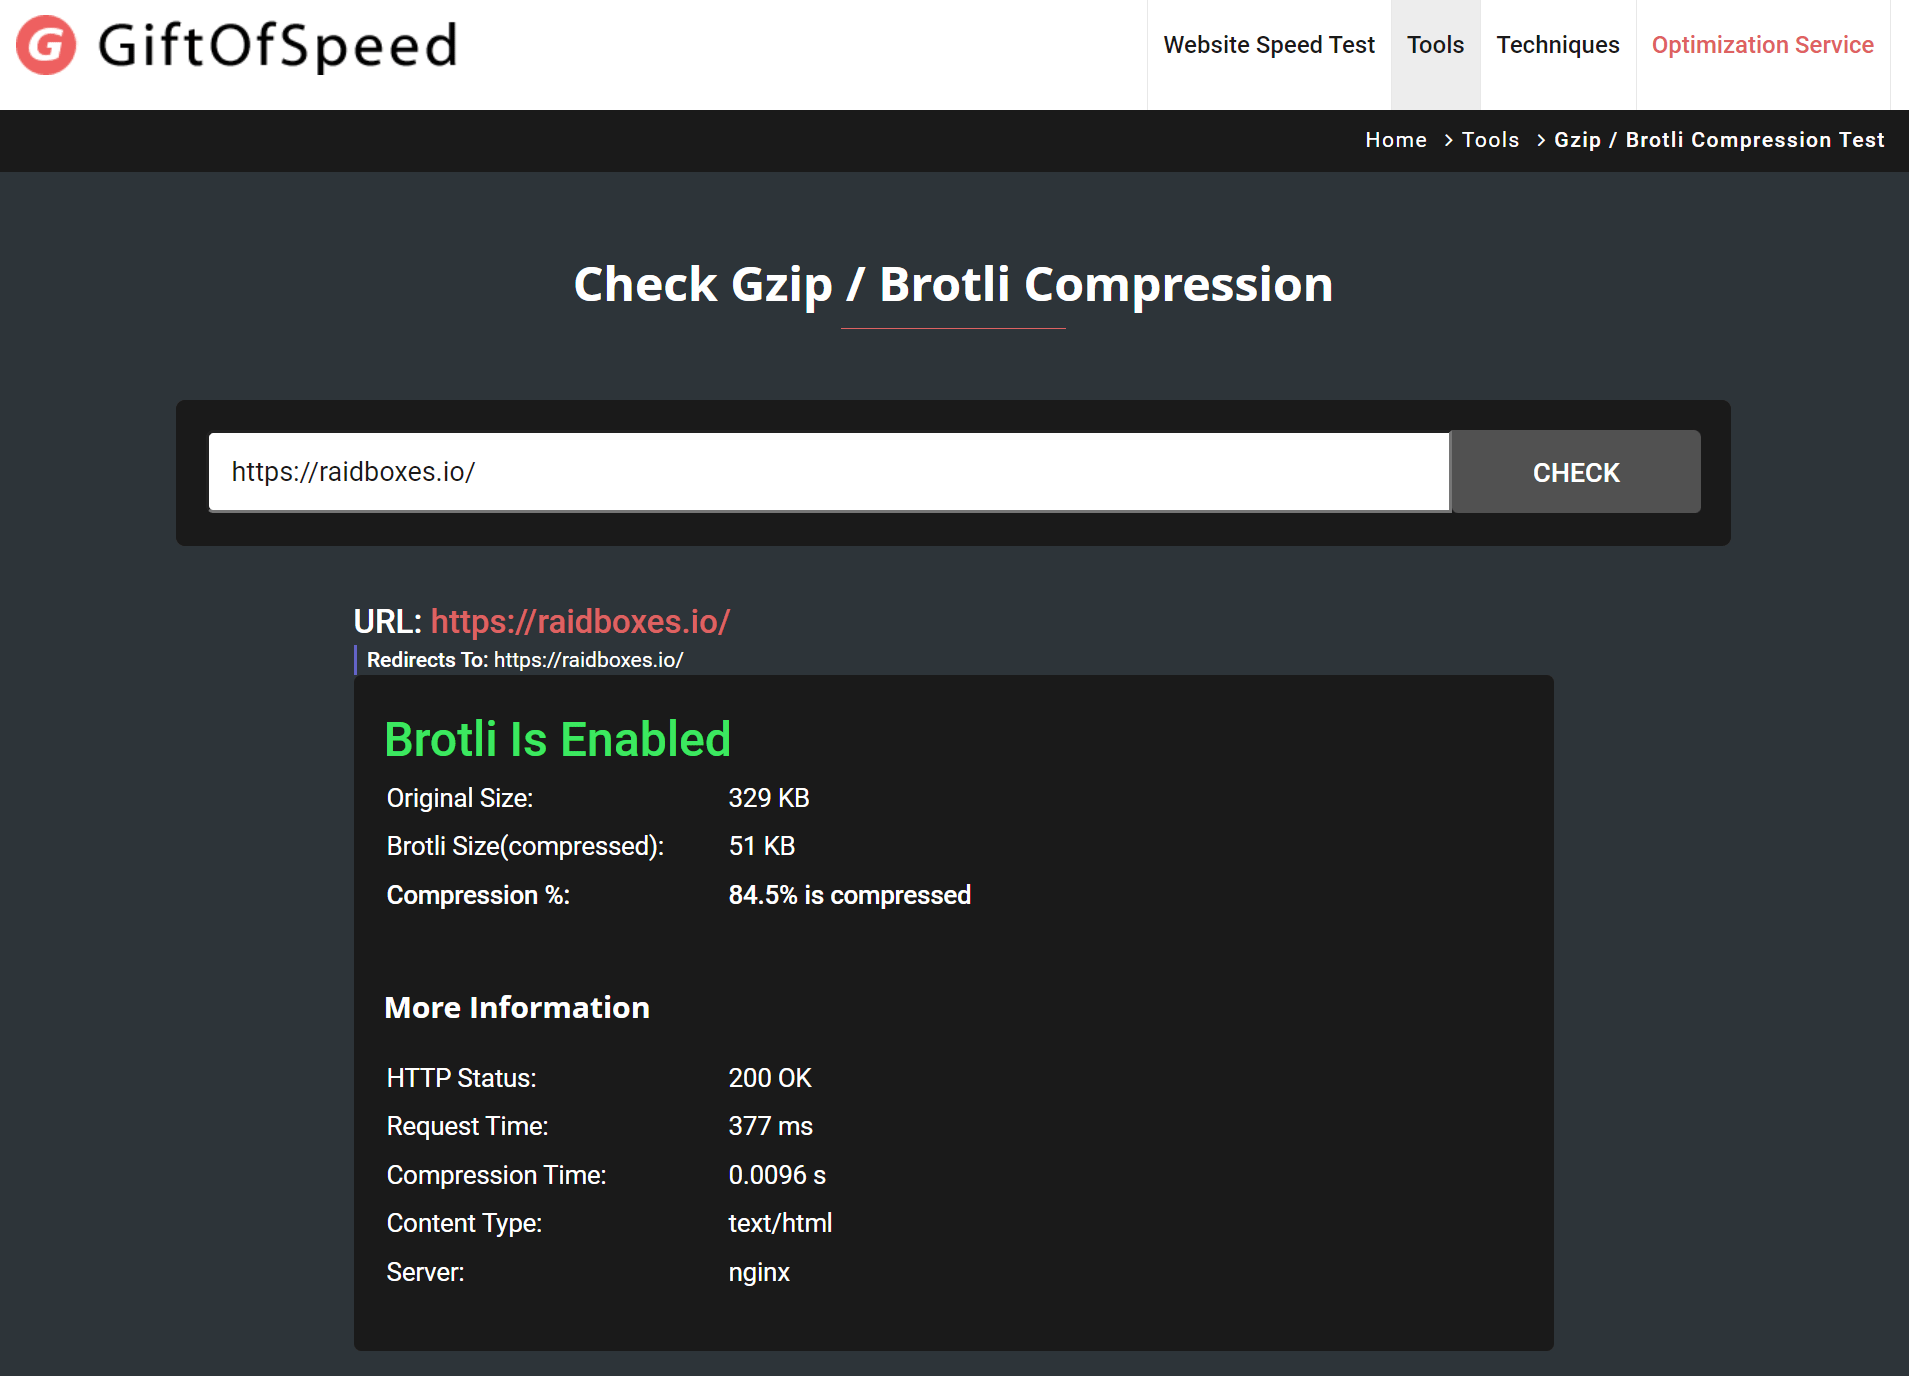
Brotli is a compression format developed by Google that is even more efficient than Gzip. Of course, Brotli is also supported by Raidboxes.
Significant optimisations for JavaScript and CSS
Especially when it comes to optimisation for FCP and LCP, there are nowadays various plugins and even directly in the themes that make it possible to achieve drastic performance gains. In my tests, these are often the best techniques for bringing a page into the 90 to 100 range. This involves the delayed reloading of CSS and JS files.
The free Autoptimize plugin has the “Aggregate JS files” setting. This is activated by default. To benefit from real acceleration, the following settings are required:
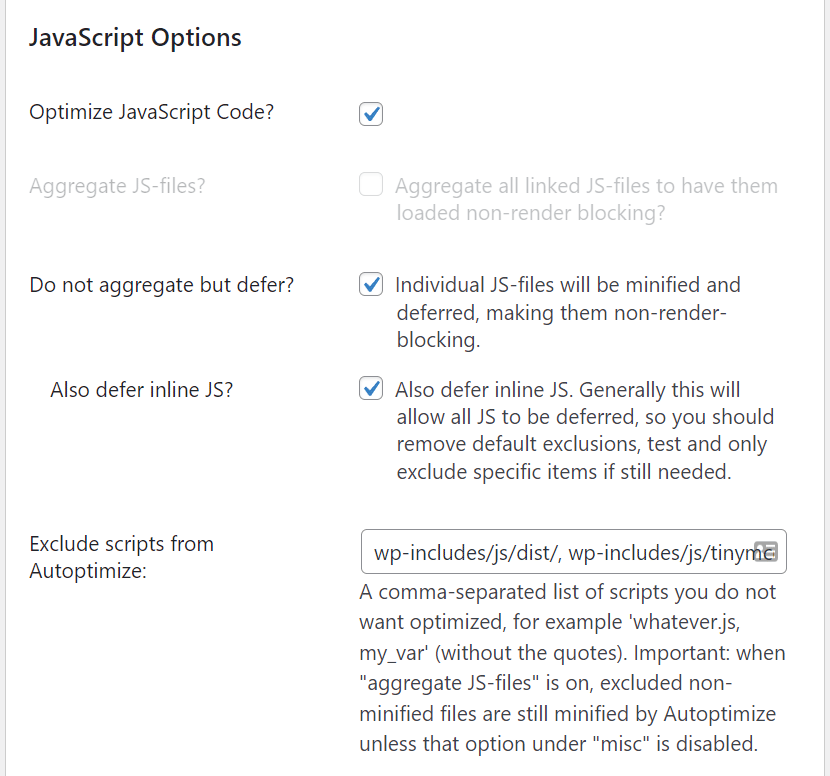
The “Defer option” ensures that JavaScript is only loaded later in the rendering process. HTML and assets are loaded first, then JS. In practice, this means that interactive elements in particular are not immediately available in the first few seconds. But the page itself is displayed at lightning speed.
As JavaScript can reload almost anything it wants, this technique should be used with caution. A lot can go wrong here. This is also the reason why the option is not activated by default. The performance gain can be gigantic, but after activating it you have to check every page to make sure it still works properly.
The same applies after every update and when using new plugins that may bring their own JavaScript files into play. It is therefore only advisable to activate this option if you can invest some time to check it regularly.
The situation is similar for CSS files. “Eliminate render-blocking CSS” must be activated here. With CSS instructions, there is the additional problem that certain pages or areas of the website should look slightly different. One part of the page looks the same (colours, fonts, position of the header), but another part looks different (image in the header, additional information in the footer, etc.).
Autoptimize refers here to an external and chargeable service that attempts to solve this problem. “Critical CSS” is the CSS that must be loaded at the very beginning. The rest can be loaded later.
Plugins such as WP Rocket and perfmatters also have such a function built in. How well this works depends entirely on which plugins you would like to use on your own WordPress website. So it only works with a test. But if it works, then the boost is really big.
Getting this function for free is currently almost impossible because it is a tough problem. Because every website is different. Even every subpage on a website is different and is constantly changing due to updates. The only way to get 100 per cent performance out of this is to develop a deep understanding of what actually happens during the loading process of each page. Only if you are prepared to go down this laborious path can you actually achieve a 100 for every page.
Conclusion – making WordPress faster
There are many things you can do to optimise WordPress performance. Fast WordPress hosting is important and the basis for everything. But fast hosting alone does not guarantee top speeds. It is necessary for this:
- To make the assets on the website as small as possible, i.e. to compress them.
- Select the correct format (such as WebP or SVG). Only load images as large as necessary for the respective purpose (desktop vs. tablet vs. mobile).
- activate caching or use server-based caching: Once a resource has been “assembled”, it can be loaded from the cache until something changes. External resources such as Google Fonts should also be loaded from your own server.
- Optimise the loading sequence. Deferring CSS and JS using a plugin or service or first loading what is really necessary, then the rest (keyword: Critical CSS).
- Getting rid of unnecessary ballast: Do you really need emojis for every loading process?
The most important tip I can give you from practical experience: Caching and deferring usually account for 90 per cent of performance. So this is where you should focus your own optimisations. I wish you every success and high speed for your projects with WordPress and WooCommerce.
Your questions about WordPress performance
We look forward to your comments and questions. For more insights on WordPress, web design and online business, follow Raidboxes on Facebook or LinkedIn – or subscribe to our newsletter.
Leave a Reply