
Webpagetest.org is probably the best and most comprehensive free tool for measuring your page load time. Unfortunately, it provides a lot of very complex data. Today I’ll show you what you need to set up, how to organise the data salad and which key values you need for a professional analysis. Because only if you know how your websites load can you optimise them to the max.
Your own website should be secure. And fast. Of course, because a lot depends on the loading time: the conversion rate, the person’s sense of security in front of the end device and the Google ranking of your website. However, many people don’t even get as far as being able to correctly determine the loading time of their own website.
For example, some people don’t even know which tools they can use to properly analyse their website. Or they don’t know which settings they need to make in order to achieve really good results. To prevent you from making the same mistakes, I’ll show you today how you can get a quick and meaningful overview of your website with the best free measurement tool (in our opinion). This way, you’ll know exactly how quickly your website is loading and whether and where you need to optimise.
To understand exactly how the individual analysis steps work, I recommend that you look at the data records linked to the important places or analyse your own website in parallel. After all, it’s not that easy to bring order to the data salad. But as a reward for the effort, you will receive some of the best data you have ever collected about your website. And especially if you work on a contract basis or earn your money with your WordPress projects, the effort is definitely worth it.
WordPress hosting management
With our Raidboxes dashboard, you get a seamless, intuitive interface that makes managing your WordPress sites easier, faster, and more efficient. Check it out!
Webpagetest is the best tool we know
Admittedly: We praise webpagetest.org effusively in this article. Perhaps too effusively, but not without good reason. Because Webpagetest is the only tool we know of that allows you to reliably determine the absolute and perceived loading time of your website. And it’s completely free. No payment barrier, no subscription model, simply valuable data and an API that allows you to automate the whole thing: that’s how it should be.
For the sake of completeness, it should be said that you can also get nice measurement results with Pingdom and GTmetrix. But not as good results as with Webpagetest. Of course, this doesn’t mean that you can’t and shouldn’t validate your results with several tests in different tools. And it also doesn’t mean that you shouldn’t measure with Pingdom or GTmetrix. I can only recommend that you take a look at Webpagetest at least once.
It has almost become a mantra for us: Tools such as Google PageSpeed Insights are not enough to measure the loading time of your website. This is because they only determine the performance potential of your website. Of course, this data is still valuable – from a performance and SEO perspective – but it simply doesn’t allow you to draw any conclusions about what actually happens when your website is accessed.
But that’s exactly what you want to know. And that’s exactly what you need to know in order to determine whether an optimisation measure is effective.
Unfortunately, Webpagetest not only provides data that is not exactly pretty, but also very extensive test results. So today I’m going to show you how to use Webpagetest and how to interpret the results.
Webpagetest was originally an AOL project and only intended for internal use. In 2008, however, the programme became open source software and is now mainly maintained and further developed by Google. The entire Webpagetest documentation can be found on GitHub and can also be downloaded and used locally.
While PageSpeed Insights shows you where your website’s optimisation potential lies, Webpagetest can do much more. Not only does it show you how you can improve your website, it also shows you directly what impact your optimisation measures have on the loading time of your website.
Unlike Pingdom and GTmetrix, Webpagetest is not a company that wants to sell a paid service (ok, except Google, but at least the service is not sold directly). Rather, you could say that Webpagetest is part of Google’s plan to make the web faster overall. However you want to assess Google’s endeavours in this context.
4 steps to truly meaningful load time data
Yes, Webpagetest is more complex than other tools. But don’t let that put you off! In this case, complexity is good. Because it means you get great data about your website. And even when you’re using the tool for the first time, you’ll get the relevant information quite quickly.
With the following four steps:
Step 1: Set test parameters
Step 2: Get an overview
Step 3: Detailed analysis
Step 4: Analysing the perceived loading time
Step 1: Set test parameters
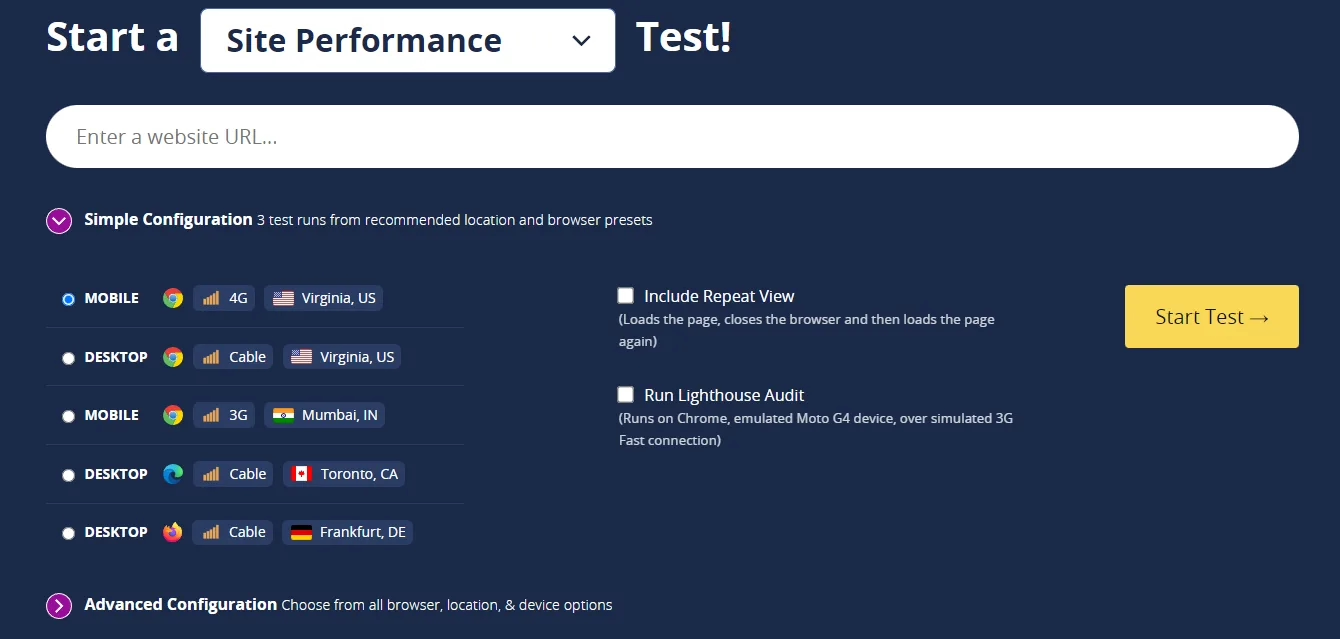
Webpagetest offers very fine-tuned settings for testing your website. Four of these settings are particularly important in order to obtain good measurement results:
- the server to be used for testing
- the browser to be tested with
- the advanced test settings, which I will go into in more detail in a moment
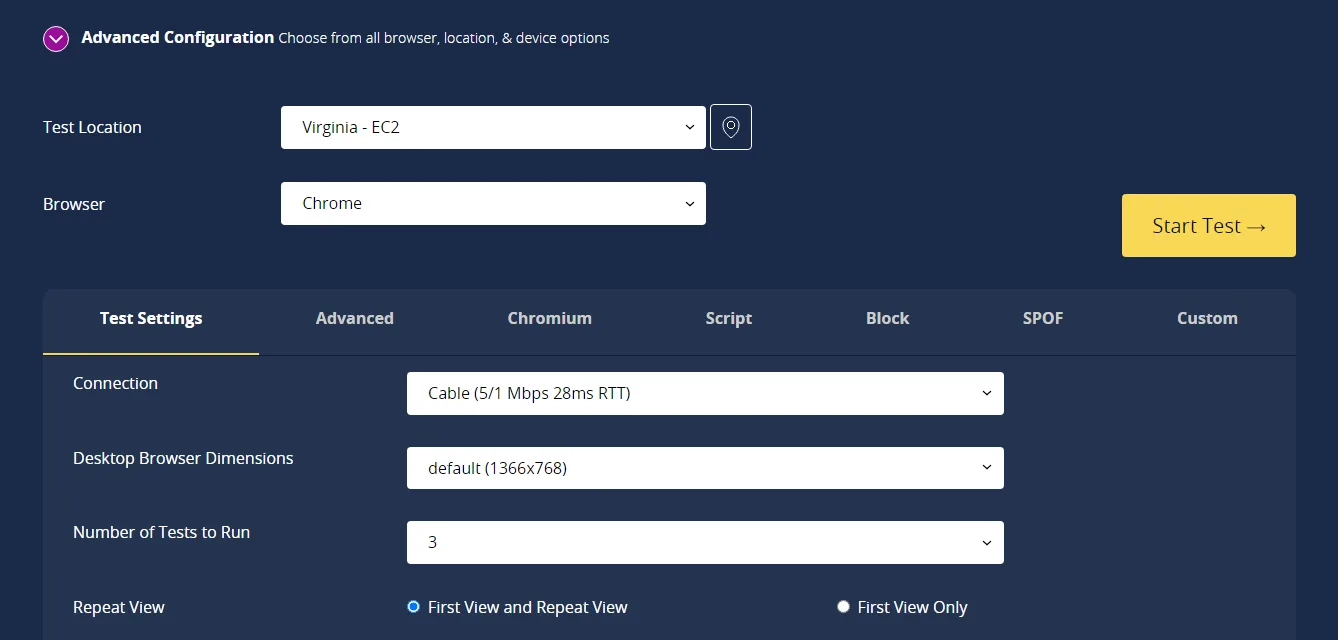
The server you select for the test simulates a call to the website from there. If you select the default server in the USA, the test result for a page view from Texas will be displayed. In most cases, however, this is not necessarily what you want. This setting is therefore very important. This is because it can massively distort the overall result and must be set accordingly, depending on the use case.
The two most common use cases are
- Determine the loading time for a user from your target group
- Load time comparison after an optimisation measure
If you want to know how the loading time of your website is perceived, then the server location must correspond as closely as possible to the typical location of the calls. For a German blog, this means that you should choose a server in Germany, for example in Frankfurt.
If you want to know what an optimisation measure has achieved, it doesn’t matter which server location you use. The only important thing is that you must use the same server location for the test before and after the optimisation. Otherwise, you won’t be able to compare the measurement data properly. Of course, I also recommend a German test server here. This simply delivers the most realistic results.
The browser used
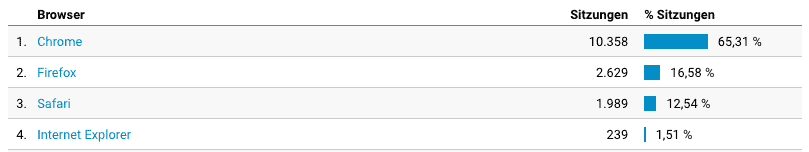
Webpagetest offers many setting options to simulate certain transmission technologies and browsers. For example, you can define that the website should be loaded via a 3G connection and Firefox. To start with, however, it is sufficient to select the browser that your target group uses most frequently.
You can view information about this in Google Analytics or Piwik, for example. Raidboxes, for example, is mostly visited via Chrome.
Very important: The advanced settings determine how good your measurement data will ultimately be!
In addition to the two parameters that determine how the test is performed – i.e. the server location and the browser used – Webpagetest also offers the option of setting what the test should output at the end. In the advanced settings, for example, you can define that only certain values should be output or that the measurement should stop automatically after a certain time. And here there are two settings that are particularly important in order to obtain reasonably comprehensive and reliable data: the “Number of Tests to Run” and the “Repeat View”.
In principle, you should always measure the loading time more than once. Otherwise, you run the risk of measuring outliers and possibly looking for a problem that doesn’t even exist. And believe me: we’ve already experienced this a few times. I recommend at least three consecutive tests.
You should also remember to always measure the cached version of your website. You can do this using the Repeat View option.
Once you have entered your URL – e.g. https://raidboxes. de – and set the test parameters (i.e. the German server, the browser, at least 3 repetitions and the repeat view), you can start the test. Depending on how many tests are currently running, the analysis may take a few minutes.
Important: Webpagetest only tests the website that is accessible under the URL, not your entire web presence. This means you should test your homepage, all landing pages and, if relevant, your product overview individually.
In this guide, I work with the data from the analysis of our homepage, raidboxes.io.
Step 2: Get an overview
The first thing you will see is the performance summary and the “Opportunities & Experiments” section. This gives you a rough overview of the potential your website has in certain aspects or whether the website is already performing well in these aspects. Webpagetest also gives you results similar to Google PageSpeed Insights.

(1) The more green, the better
In the second area, the test parameters are listed again for checking. Green indicates a good degree of optimisation, orange indicates usable optimisation potential and red indicates an urgent need for action.
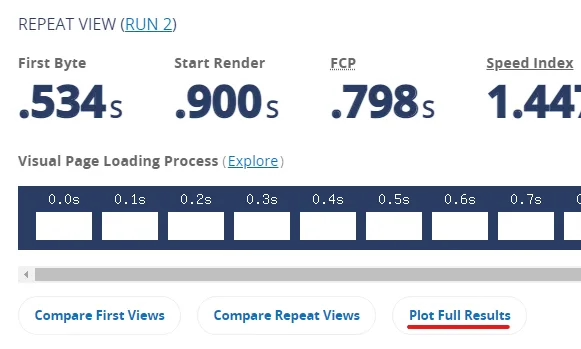
You are presented with all the relevant key data for the page load time for the cached and uncached version of your website. The First View is uncached and the Repeat View is cached. The important thing here is: In the overview, Webpagetest only displays the values for one of the three tests. The text in brackets directly next to the First View and Repeat View labels shows you which test this is. Run 2 is therefore the result for the second test run.

I will now explain the two important parameters:
- First byte: Time until the first data byte is transmitted between the client and the web server. If possible, this value should be less than 200 milliseconds and is an important indicator of the performance of your hosting.
- Start Render: This value describes the time it takes for a website to load until content is displayed for the first time. Until this time, the website remains completely white for the user. Of course, this value should also be as low as possible. Together with the total duration of the visual page layout, this value forms the evaluation standard for the perceived website speed. Start Render marks the beginning of the visible loading of your website.
The following applies to all these values: the smaller, the better. As a guide, you can remember this:
- the time to first byte should be less than 200 milliseconds
- Start render should not be longer than 2.5 seconds
- The entire visual page layout should not be longer than five seconds
Of course, these values are only rules of thumb. It always depends on your website: A shop page with 50 products – i.e. 50 or more images and descriptive texts – naturally loads more slowly than an imprint page consisting only of text.
So I can only advise you: Also test the websites of your direct competitors and your role models. This will give you comparative values within the industry.
Calculating mean values – Now it’s time to get down to business
Unfortunately, the overview explained above only shows the results of a single measurement run. And remember: individual, isolated values can lead you astray. That’s why you carried out at least three consecutive measurements to test your website. And the average values of these three measurements are the best approximations you can get for your page load time.
And don’t worry: it only takes the touch of a button to create the average values:
Before you continue, you should first tick both First and Repeat at the top.
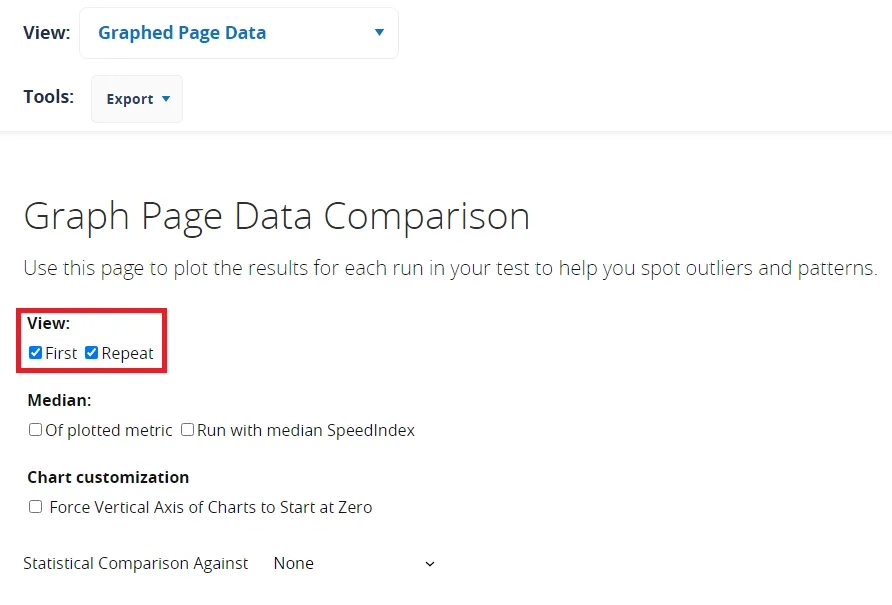
Now you get an initially confusing amount of data from so-called plots. And these are exactly the results you want. In principle, this new overview is the same for all values. So once you have understood how to read them, they are anything but confusing.
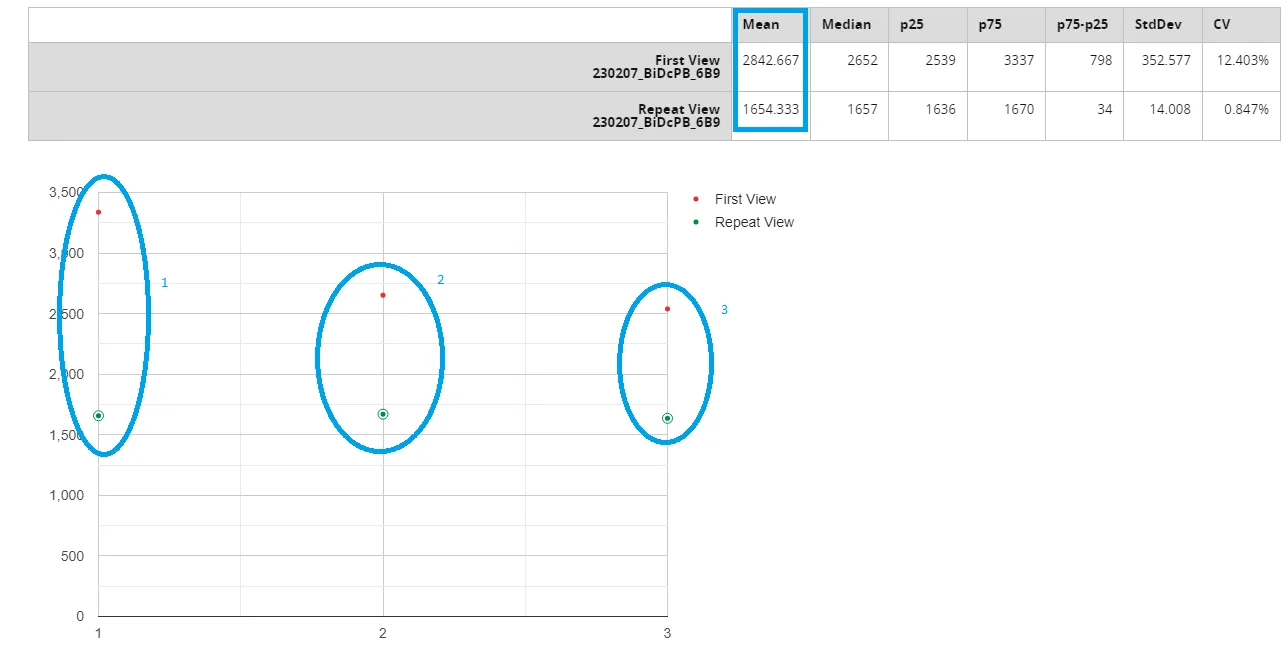
As you can see, all three measured values (1-3) are plotted here in a diagram. Above the plot is the value to which the diagram refers. The number in the Mean column now describes the average value of the loading time across all three measurements. This average value is the most valuable information you can obtain about your website.
By the way: By ticking the Repeat box, you can also display the values for the loading time with and without caching. And if you want to find the results for the other values: Simply search for “First Byte” and “Start Render” using your browser search (CTRL+F for PCs and cmd+f for Macs).
Interim conclusion: A lot of work for particularly valuable data
Ok, that was a lot of input. And it was a lot of steps. Especially compared to simple test methods. But the effort is worth it, as you can see from the figures in the diagrams: Two tests with the same settings can sometimes be a whole second apart. In some circumstances, it’s chance that decides whether you invest time and money in further optimising your website or not. And especially if you earn your money with WordPress, be it with your own shop, a web design business or your own agency, you should have the best data basis for such a decision.
However, we haven’t actually reached the end yet. Because although you now know the key performance indicators of your website, i.e. how quickly your website loads and whether there is still potential for optimisation, you still don’t know where exactly your website can be improved. And this is exactly what the detailed analysis is for.
Upselling, cross-selling & measuring success
Discover how to effectively measure and boost cross-selling opportunities with actionable strategies tailored for agencies and freelancers on the Raidboxes blog.
Step 3: Detailed analysis
The overview already tells you a lot about your website. You can see whether there is still room for improvement in certain areas, how fast your website actually loads and whether it could load a little faster. However, you will not yet recognise the causes of the problems. You can find these in the detailed reports:
- the waterfall diagrams
- the potential analysis
The waterfall diagrams list every single HTTP request that a browser makes to the web server. At first glance, these diagrams appear very complex and confusing. But if you know how, you can get a lot of details about your website from a waterfall chart at a glance. Here we show you how to read waterfall charts correctly and how you can use them to further optimise your website.
Basically, a fast website has a short waterfall chart with few, short requests. This means that the length of the diagram and the length of the bars in the individual lines are particularly relevant.
In the performance review you will find detailed information about how well the performance of your website is already optimised. This detailed review contains:
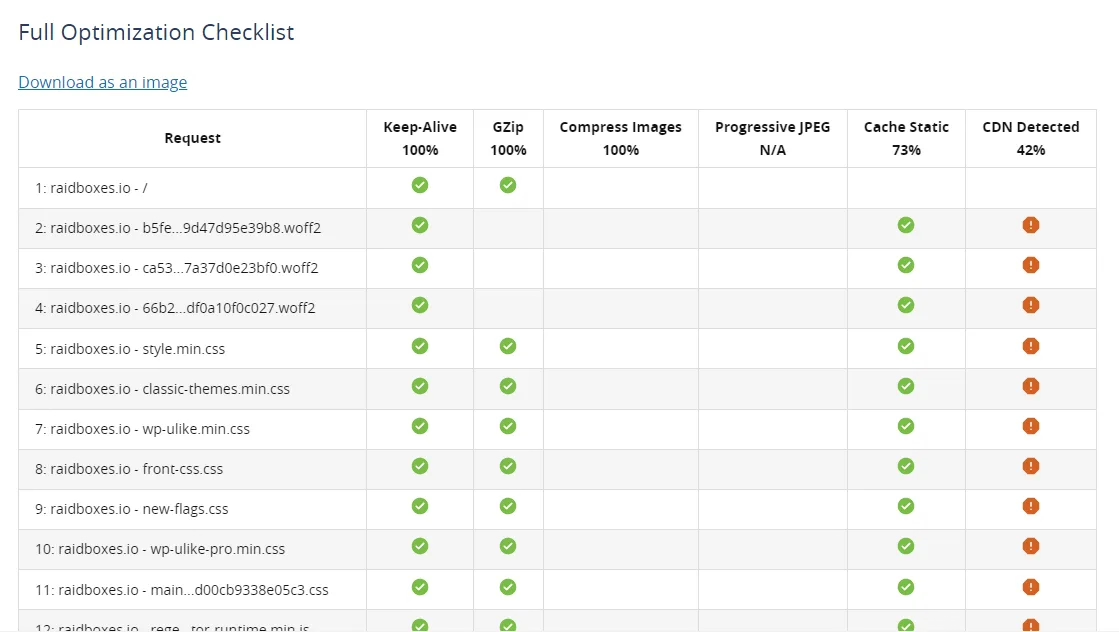
- the Optimisation Checklist, which can be found under the menu item “Optimisation”
- the detailed breakdown of the performance test
In the Optimisation Checklist, you will find the individual evaluation criteria that are applied to each of the HTTP requests. A green tick means that the requirement has been met, a yellow triangle indicates a need for improvement and a red cross indicates the absence of the proposed optimisation measure.
Finally, you will find a description of the warnings and missing optimisation measures in the details section. Webpagetest describes the optimisations that are still possible for each resource. In the case of images, for example, it shows how much data volume can be saved.
You will have to spend some time with these detailed analyses, but with their help you can get a detailed picture of your website and its optimisation potential.
And because this is basically the same information that PageSpeed Insights spits out, you can of course simply run a PageSpeed analysis in parallel. This test is a lot prettier and better prepared.
Step 4: Analysing the perceived loading time
In contrast to all other tests known to us, Webpagetest is the only one that displays the perceived loading time of your website free of charge. You can use the filmstrip view to watch a video of the page loading. This allows you to see exactly what can be seen when loading and can help you assess whether and how your website should be optimised.

The perceived load time is probably the most important parameter of your page load time. It influences whether your website is abandoned prematurely, the likelihood of conversion and the overall experience of your website. For shops in particular, the perceived speed of the website is therefore an important benchmark. Of course, the perceived loading time should always be as low as possible.
In addition to the filmstrip view, you should remember the following:

The Filmstrip View shows you exactly how your website looks and which processes are being carried out at any given time, right down to a tenth of a second. It is often the case that nothing happens for up to several seconds, and then all of a sudden the website looks almost exactly as it did in its final state. This gives the impression that the website has finished loading within this time. Or you already have the feeling that you can interact with the website.
The Filmstrip View is therefore a very valuable tool, especially when prioritising the visible page content.
Conclusion
Ok, after reading this article, you should now be able to choose the right settings for a webpage test. Now you should also know which key figures you need to interpret and how, and how to prevent misinterpretations due to outliers. You also know where to find detailed information about your website and how to determine and display the perceived loading time of your website.
You now know the important basics to get a really comprehensive overview of your website. And you know where to get the information that will allow you to fill the measurement results with life and draw meaningful conclusions for your website.
But why was that important again? Quite simply, without a proper measurement of the actual status of your website, you cannot properly assess how your website is currently loading. And secondly, you lack information for optimising the loading time.
Do you have another tip for using Webpagetest? Perfect, then write a comment on this post!
Leave a Reply