
If you have found your way to this article, I assume that you have encountered an error on your WordPress website. Or that you’re a person who regularly carries out maintenance work and expects to come across an error. Either way, I want to remind you that writing code and writing bugs go hand in hand. Even the best developers make mistakes. So that you don’t despair over these mistakes, I’ve written you this guide to WordPress Debug Mode. It’s a very helpful tool for discovering and understanding errors in WordPress.
The first step in debugging your code
Lean back in your chair, take a few deep breaths and realise that all developers have written bad code at some point. Every time you write bad code, you learn something – and when you learn something, you will continue to develop and improve your skills
It can feel like a bug is just there to drive you crazy, but luckily that’s relatively unlikely 😉 The good thing is that unless you’re dealing with the very latest technology, there’s a good chance that someone else has already encountered the same bug.
What is debugging?
If you’re not familiar with the term debugging, it’s literally in the name: de – bugging. In computer language, an error in your code is called a bug. So debugging your code means removing errors from your code. Although people like to assume that bugs are caused by their own employees or poorly thought-out software updates, the truth is that many bugs are your own doing – and it’s best to come to terms with this early on.
WordPress hosting management
With our Raidboxes dashboard, you get a seamless, intuitive interface that makes managing your WordPress sites easier, faster, and more efficient. Check it out!
Why PHP debugging seems more complicated than JavaScript debugging
Maybe you are used to debugging in another language, for example JavaScript. What’s a little confusing is that JavaScript is only executed after your website has been rendered – at least that’s the standard on the web and the reason why you include your .js file at the end of the HTML document. This means that your website can still be displayed even if there are JavaScript errors. If you don’t notice this or don’t check your console log, you may not even know that an error has occurred.
However, PHP is a server-side language and is used to build your website (although it can do much more than just that). So if there’s an error in your PHP code, your website may stop loading and visitors won’t see any content. As such, PHP errors are usually more obvious.
Subscribe to the Raidboxes newsletter!
We share the latest WordPress insights, business tips, and more with you once a month.
Debugging in WordPress with WP-Debug
What is the WordPress debug mode?
If the WP debug mode (sometimes also called wp-debugger or wp-debug) is activated, it shows you errors, notes and warnings that are reported by the WordPress system. The wp-debugger is deactivated by default. The PHP constant wp_debug is the global variable that indicates the status of the WordPress debug mode via a Boolean, i.e. whether it is switched on or off.
Why should you use WordPress Debug Mode?
Because WordPress uses a few different core components:
Frontend – HTML / CSS
Backend – PHP / Database
Plugins – PHP applications created by third-party providers
It can therefore be quite difficult to find out what has caused a problem on your website. The wp-debugger is a tool that you can use to display or log the errors.
Before you start debugging, create a backup!
There is an old saying: “Prevention is better than cure”. This means that it is best not to let a problem arise in the first place. For you, this means: secure your data!
A 30-minute maintenance job can quickly turn into a 5-hour nightmare just because no backup was created before someone messed with the internal files.
Fortunately, if you host your website with Raidboxes, the backup is created automatically! Just go to your dashboard, click on the “Backups” tab and view all your daily backups.

If you want to make changes and need to create a manual backup, click on the “Create manual backup” button and give the backup a name. Tip: Choose a name that makes as much sense as possible so that you can recognise the backup later. Now you can play around with your website as much as you like! If something goes wrong, simply restore your backup.

Switch on WordPress debug mode with Raidboxes
In your Raidboxes dashboard you can switch on the wp-debugger in the settings of your box with one click:

If you click on WordPress Debug Logsafter activating WP Debug Mode, you can see which errors are thrown by your WordPress website in the live log. You can access the debug log itself either via the settings under WP Debug (see screenshot) or via the BOX overview. You can also access the WP debug log files via FTP: Your log files are stored in the /wp-content/ area in the debug.log file.

You can find more information about error analysis for your WordPress website at Raidboxes in our help centre.
Do you need the wp-config.php for debugging?
With Raidboxes you can activate the WordPress debug mode with just one click in your dashboard. The wp-config.php is read-only for security reasons. However, you can make special entries in your box settings under WordPress > wp-config.php if required. Very important: Only use this feature if you are sure what the entries will do. Editing the wp-config.php can lead to a faulty website. Before you add an entry, you should therefore check whether you have already created a backup.
In the next section, we explain how to activate WP Debug Mode via wp-config.php if you are developing locally.
Activate WordPress Debug locally
In your local development, you can activate wp-debug by editing the wp-config.php file in the root directory of your WordPress folder and adding the following code:
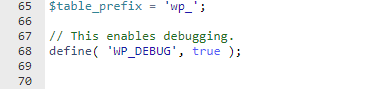
// Dies aktiviert das Debugging.
define( 'WP_DEBUG', true );
You may also discover that this statement has already been added, but the value is false. If this is the case, simply set it to true.
// Dies deaktiviert das Debugging.
define( 'WP_DEBUG', false );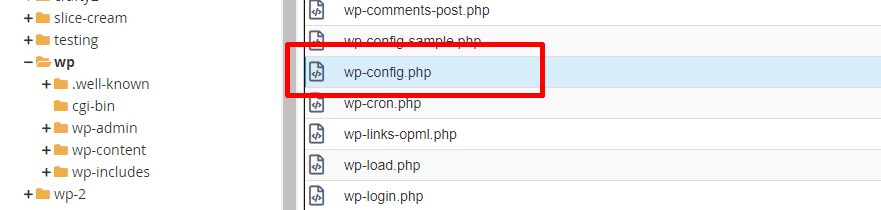
At this point, I would like to emphasise once again how important a backup is. Now is a good time to check this again.
WordPress Debug Mode is now active – and now?
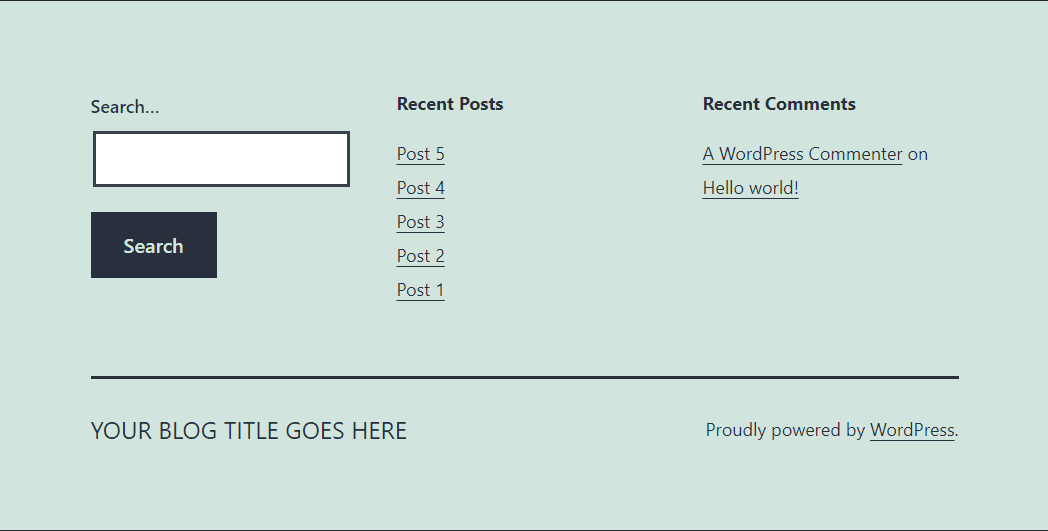
Now that the wp-debugger is activated, errors are displayed directly in the browser window (if WP_DEBUG_DISPLAY is set to true) – this is both a blessing and a curse. On the one hand, you can see errors, but on the other hand, all users of your website can see them, which is not ideal. To give you an example, I have added a small unknown function to the footer of the standard WordPress theme “Twenty Twenty-One“.
Before activating wp-debug:
After activating wp-debug:
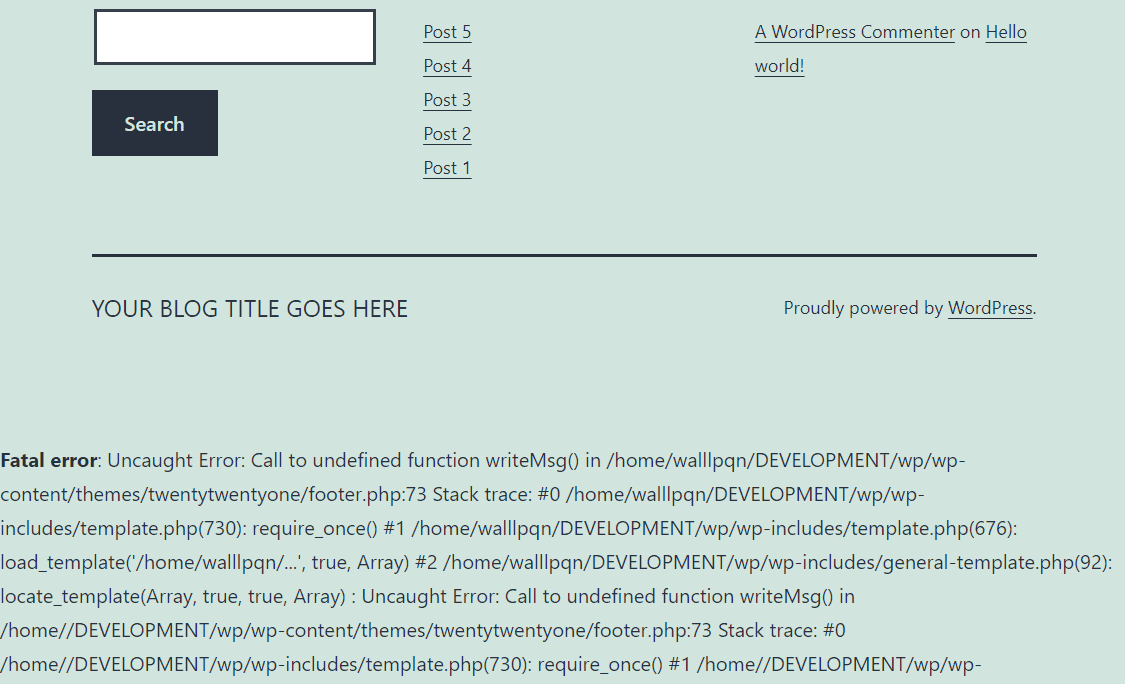
You probably don’t want visitors to your website to see this, do you? The error message not only disturbs the design, it could even reveal sensitive information. For example, before I made some changes to the output, my username was displayed and any hacker could use this information to launch an attack.
Are your errors being logged?
If you activate WP-Debug, the error information is not saved, but only displayed. To save this information, you need to activate wp_debug_log – this is covered in more detail later in the article.
How to activate WordPress debug mode and prevent errors from being displayed in your HTML code
Fortunately, there is a solution to this problem in WordPress. Add the following code to your wp-config.php:
define( 'WP_DEBUG_DISPLAY', false );This prevents errors from appearing in your website’s HTML code and saves your users the nightmare you may have caused. The final piece of the puzzle is how to check errors without publishing them. Welcome to error logging!
Activating error logging in WordPress
In the wp-config.php file, you must activate WordPress error logging. This will create a .log file with the logs and details of the errors that have occurred on your website.
define( 'WP_DEBUG_LOG', true );You can usually find the log file in the wp-content folder of your WordPress website, unless you have a valid file path for this log as specified below:
define( 'WP_DEBUG_LOG', '/tmp/wp-errors.log' );However, my error log was written to the WordPress root directory. So if you can’t find your error log in the wp-content folder, you should look elsewhere:
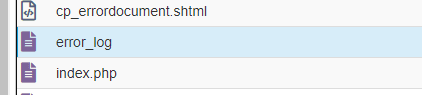
Checking an error log
Error logs give you pretty clear indications of what went wrong. But just because something is clear doesn’t mean you understand it, so let’s break it down.
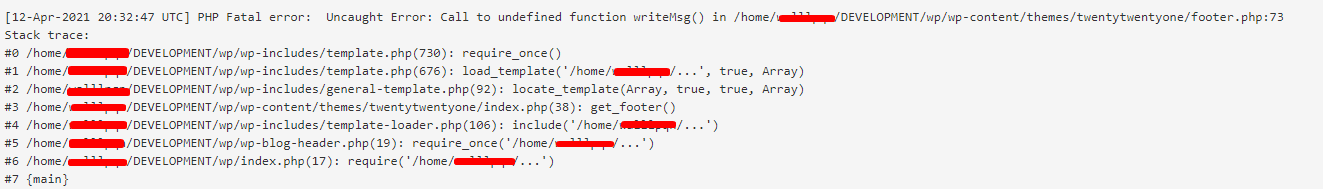
- Time of the error: [12-Apr-2021 20:32:47 UTC]
- Type of error: PHP Fatal Error
- Cause of the error: Uncaught Error: Call to undefined function writeMsg() in
- Where the error occurred: /home/XXXXXXX/DEVELOPMENT/wp/wp-content/themes/twentytwentyone/footer.php:73
In case you’re wondering what the error I put in is, I defined a wrong method called writeMsg() in the footer.php file that causes an error.
Don’t forget to deactivate!
Important: Don’t forget to deactivate WordPress debug mode again after your analysis. If you leave it active, WordPress writes all errors it finds to the debug.log file. If errors occur regularly, this file may become too large and use up your storage space.
Is the WordPress error log too large?
Error logs can grow over time if they are not checked. Remember that not only errors are logged, but also warnings and notices. If there are new PHP versions, certain methods may become obsolete or plugins may no longer be supported. In this case, more errors are generated.
Normally, an error log should only be a few kB in size, but even then it is tedious to search through it. In worse cases, the errors are logged in a file that is already several MB in size and contains thousands of lines of text. In addition to the increased confusion, this leads to slower response times of the log file and can slow down your troubleshooting enormously due to waiting times when loading the log. What can you do then?
Managed WordPress Hosting
With our Managed WordPress hosting, you get a powerful, secure and easy-to-manage solution that quickly and reliably takes your WordPress project to the next level. Check it out!
Download the file for archiving and then delete it!
If the WordPress error logs have been activated in wp-config.php and no error.log file can be found, WordPress creates a completely new file and fills it with the current errors.
Conclusion
Debugging code makes development both challenging and rewarding. Because mistakes force you to expand your knowledge, develop a positive attitude and think outside the box. If you have any questions or difficulties with debugging your WordPress website, feel free to leave a comment or get in touch with us in the support chat. Have fun debugging!
Your questions about WordPress Debug Mode
If you have any further questions about WordPress Debug Mode, feel free to use the comment function. For more insights on WordPress, web design or online business, follow Raidboxes on Facebook or LinkedIn – or subscribe to our newsletter.
Leave a Reply