
How fast does my website load? This is one of the key questions when it comes to performance, UX and search engine optimisation. You should rely on the right tools to answer this question. Because only a few tools provide really good data.
There are some great overview articles online about tools that can be used to measure the performance and loading time of your own website easily and, above all, free of charge. These overviews are very helpful, but often make a mistake that can lead to more confusion than clarity. They compare two or three completely different types of tools with each other and sometimes do not go into enough detail about the differences.
This can then lead to attempts to make performance comparisons with completely unsuitable data. This is a pity, because using the right tools for measurement saves a lot of time and trouble.
One difference should be recognised when measuring the performance of a website: The difference between potential analyses and tools that measure the loading time of a website. The first group includes tests such as Google PageSpeed Insights and Yahoo’s YSlow. These tools indicate how well the tested website fulfils the requirements for a fast page load. Both therefore provide excellent input for on-page optimisation. However, such tests do not measure the loading time of your website.
Our WordPress speed test
Check your loading time and receive the result by email! Together we’ll find the best solution for you and your company. Or test our WordPress hosting directly for several days free of charge!

But that’s exactly what you usually want to know: How long does it take for my website to be set up, for people to interact with it, for me to make money? And this is the crux of the matter: to our knowledge, there are actually only two free tools that provide really good data here:
I will therefore show you below what the measuring tools can do, how to use them and how to interpret the data so that you can get the most out of the measurements.
Three properties make a measuring tool particularly valuable
The tools I mentioned are so good because they provide particularly valuable data. This means that the measurement results:
- Consist of the results of several measurement methods that can be compared.
- be output in a high level of detail.
- Can be customised using various setting options.
In practice, this means that with a good measurement tool you can set how it measures the loading time of the website. This is mainly the selection of the test server and its location and sometimes also the selection of the test browser.
The level of detail of the data means that not only time data is output, but also a detailed description of what was actually measured. Two tools may well understand “loading time” to mean something different. Of course, it is even better if standardised terms are used, such as Time to First Byte.
And finally, it is good if not only the loading time of your website is measured, but also information on the number of HTTP requests, the size of the data packets loaded or the results of potential analyses are displayed at the same time. This allows you to quickly see which adjustments you can make to optimise the loading time.
Other tools we are familiar with offer such options only to a limited extent or not at all and can therefore lead to problems of understanding and therefore interpretation. For you, however, these advantages also mean a decisive disadvantage: the data is nowhere near as easy to understand as the results from Google PageSpeed Insights, for example.
Measurement data is not always easy to read
The most daunting part is certainly the so-called waterfall chart. However, this provides particularly important data. It is therefore worth taking a closer look at this type of diagram.
In this post, I will first explain WebPageTest in more detail. This is a tool that can quickly provide very informative information about your website and also measures the loading time of your website.

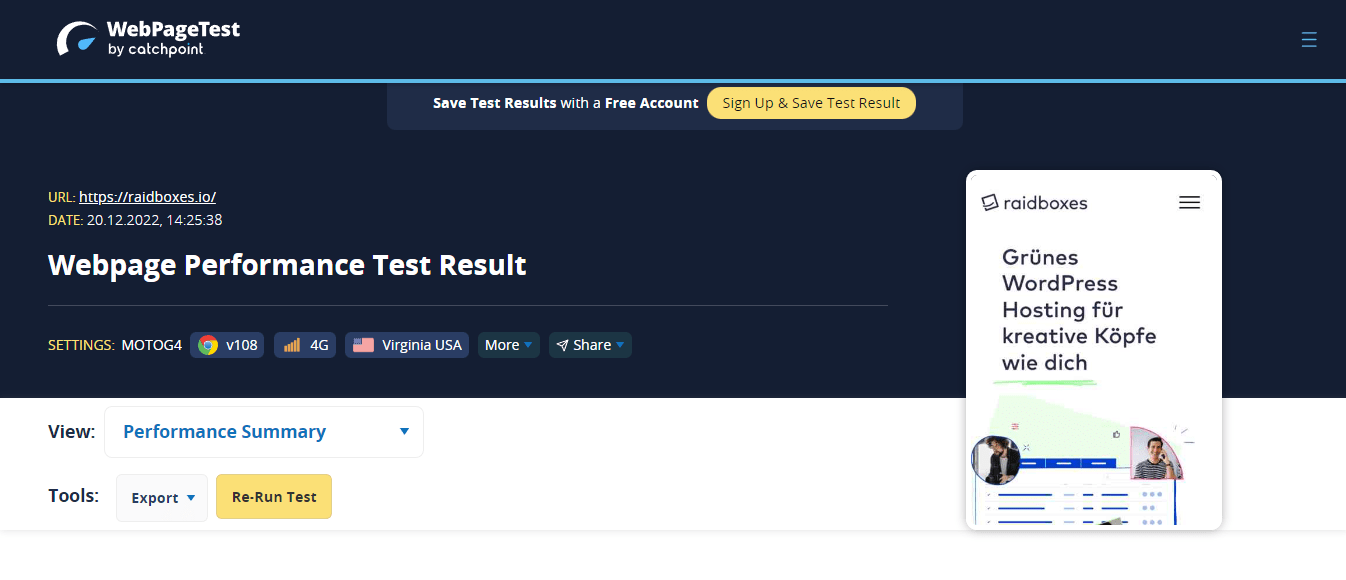
My favourite: WebPageTest
webpagetest.org is fast and very easy to use. In principle, you only have to do two things:
- First enter the domain to be tested
- then select the server location
The server location is – in addition to the choice of browser to be tested – one of the most important settings for understanding how and how quickly your website is set up in different regions of the world. In such tests, the server location indicates the location from which your website is accessed for the speed measurement.
Always make sure to use the same server location, especially when comparing performance. This is the only way you can meaningfully compare the results. If the loading time of your website is measured once from the USA and once from Frankfurt, the loading times will differ significantly.
When you start the test, three large data packets are ejected after a few moments:
- brief overview: Opportunities & Experiments
- measured numbers of your website: Observed Metrics
- Customised test runs with waterfall diagrams
The first part, “Opportunities & Experiments”, gives you practical tips on which parts of your website are working well and where there is still room for improvement.
Our WordPress speed test
Check your loading time and receive the result by email! Together we’ll find the best solution for you and your company. Or test our WordPress hosting directly for several days free of charge!
Here you are presented with ratings and suggested solutions for various performance-relevant aspects of your website – similar to the tools from Google or Yahoo. It is important to understand that it is not the loading time of the website that is measured here, but the potential for optimising the loading time.

The loading time of the website is the central parameter with which performance comparisons in particular can be made. It is the direct answer to the question: How fast does my website load? The number of HTTP requests is also well suited for such comparisons. The rule here is: the fewer HTTP requests, the better.
The second section consists of the measured figures, i.e. the metrics. Below this is the visual page structure in the form of a series of images in steps of 100 ms. This is also referred to here as a “filmstrip”. Images that show a significant change in the page structure are highlighted in colour.

The third part shows you an overview of the test runs. Here, the HTTP requests and the content of your website are broken down by type and source. This allows you to quickly recognise whether a certain type of content, including images, is consuming a particularly large amount of space or producing a particularly large number of requests and thus slowing down your website.
The waterfall diagram shows you in detail the order in which the requests run and how long each request takes to load. The waterfall diagram is therefore a detailed view of the loading time of your website.
You will also find a legend at the end of the test results that explains what the symbols and colours mean.
In our case, you can see the first contact with the server at the top and then the loading times of the individual scripts.
This allows you to view each individual request and compare it with another measured value. This allows you to determine whether the loading time of your website has improved after an optimisation measure and, if so, by what factor.
Advantages: fast, relevant, informative
Overall, WebPageTest is a good tool for measuring the loading time of a website. You can use it to quickly recognise
- how quickly a website loads
- how big it is
- where it still has potential for optimisation
- how this potential can be utilised
- how the structure of your website works
If this information about WebPageTest is not enough for you, I recommend that you go into more depth.
Note the perceived loading time
The loading time of a website is important, no question about it, both for the experience and for conversion. However, it is not the actual loading time that is decisive for people, but the perceived speed of the website – or in other words, the time it takes for the website to load visually. The website is experienced without knowledge of the measured values. The perceived loading time is therefore an important value for optimising the conversion and bounce rate. This can also be measured reliably.
The relationship between page load time and the conversion rate in shops has been well researched in the past. The result: every second counts. Because on average, people are impatient. A loading time that is one second longer can result in a seven per cent lower conversion rate.
So for every second that your website takes longer to load, you lose revenue. Above-the-fold optimisation can be an antidote – because this measure reduces the perceived loading time, among other things, which in turn can lead to better conversion rates.
Your website may take ten, twelve or thirteen seconds to load, but after just three seconds it appears to be fully loaded. Your website would therefore be perceived much faster than it is.
Managed WordPress Hosting
With our Managed WordPress hosting, you get a powerful, secure and easy-to-manage solution that quickly and reliably takes your WordPress project to the next level. Check it out!
Time series analysis and video function for the perceived loading time
1) The time series analysis
Comparing the loading time of your website over several days or weeks can be very revealing. For example, if you optimise your website step by step over several weeks.
2) Video analysis – the best indication of the perceived page load time
The video function or image series, which take a screenshot at certain intervals during the loading process, are the best way to measure the perceived loading time. You can see how long it takes until a visual representation is visible. Logical. But this simple trick allows you to get a clear differentiation between the measured and perceived loading time. WebPageTest offers this feature in the “Observed Metrics” section as “Visual Page Loading Process”.
GTmetrix
I would like to briefly discuss GTmetrix here. Essentially, the two tools WebPageTest and GTmetrix can do the same thing. GTmetrix is just as easy to use as WebPageTest: you enter the URL of the website to be tested and the tool spits out the result after a few moments. The disadvantage:
- GTmetrix offers only one server location, Vancouver
- GTmetrix tests only with Firefox
This means that the measurement results from GTmetrix always apply to a desktop computer with Firefox in Vancouver. As long as you work exclusively with GTmetrix for your performance measurement, this does not affect the results. However, if you want to know how fast the website loads for German visitors, you will need to use a different tool.
Conclusion
Measuring the loading time experience is also fundamental to analysing the loading time. This is because it allows comparisons to be made on a level abstracted from the mere data. We can only recommend tests that enable video analysis or comparable functionality. This is because the measured load time may be quite high, but the perceived load time is absolutely acceptable. The value not only allows you to better understand how your offer is perceived, but also whether it is worth optimising the website in terms of performance. After all, it may be worth investing more in conversion optimisation than in the loading time of the website.
When it comes to performance measurement, WebPageTest is the ultimate free measurement tool for us.
Which tools have you had the best experiences with so far when analysing performance? Have you had any experience with other measurement tools that might provide even better data?
Subscribe to the Raidboxes newsletter!
We share the latest WordPress insights, business tips, and more with you once a month.
Leave a Reply